
It has been some time since we last looked at US housing.
The bubble continues to deflate. With the last two quarters of data for 2011 now posted (look for the link to the excel data in the third paragraph from the bottom) we have an additional point on our two-d reconstructed phase space portrait of the Case-Shiller index.
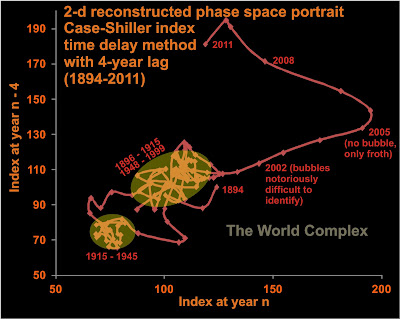
For this graph I have taken the average of the four quarterly values of the Case-Shiller index as the value for the year. Quarterly data have been available since 1953. The method of constructing the plot from the data series have been previously described here and here.
Last time I inferred that the housing price system would return to one of the two highlighted areas of Lyapunov stability at the lower left of the graph. In 2011 the system began to move in that direction. Further motion in that direction is virtually guaranteed as the index value for 2011 was about 118, which means that the curve will "fall" to that level (on the vertical axis) in 2015.

Recall that the plot is constructed by plotting the "current" value of the index against the lagged value--in this case, the value of four years previous. Hence the coordinates of the state for 2011 are the present index value (on the x-axis) against the index value in 2007 (on the y-axis). In 2015, the state will plot at coordinates given by the value of the index in 2015 on the x-axis (we don't know what that value will be) against the index value in 2011 on the y-axis (which is 118.1). While we don't know exactly where the point will plot, it will be somewhere on the yellow horizontal line added to the above figure.
Where on the yellow line depends on whether house prices rise, fall, or stay relatively constant between now and 2015. For your amusement I have three scenarios plotted on the above figure (please note that the Case-Shiller index is adjusted for inflation, so a rising price has to occur in real, not just nominal, terms).
Balance the three scenarios against their relative probability. The likelihood of rising house prices seems unlikely given the expected increase in foreclosures about to strike the US housing market.
No comments:
Post a Comment